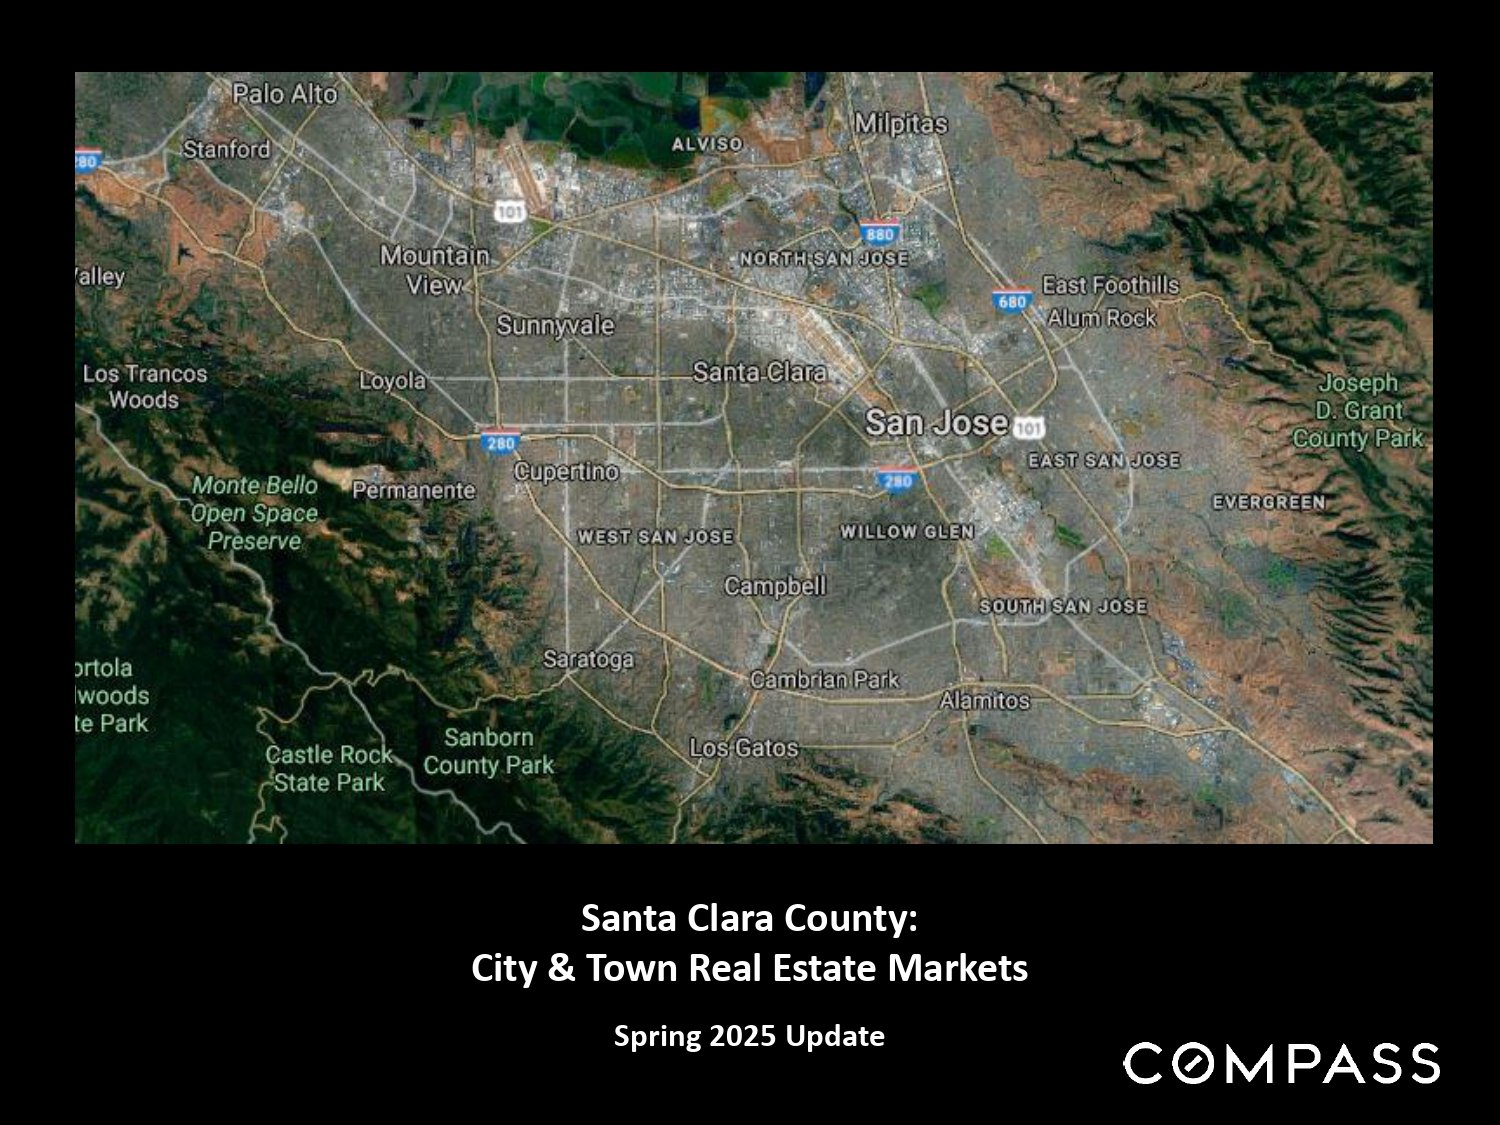
Santa Clara County real estate market update cover, with a map of San Jose and surrounding cities.
 
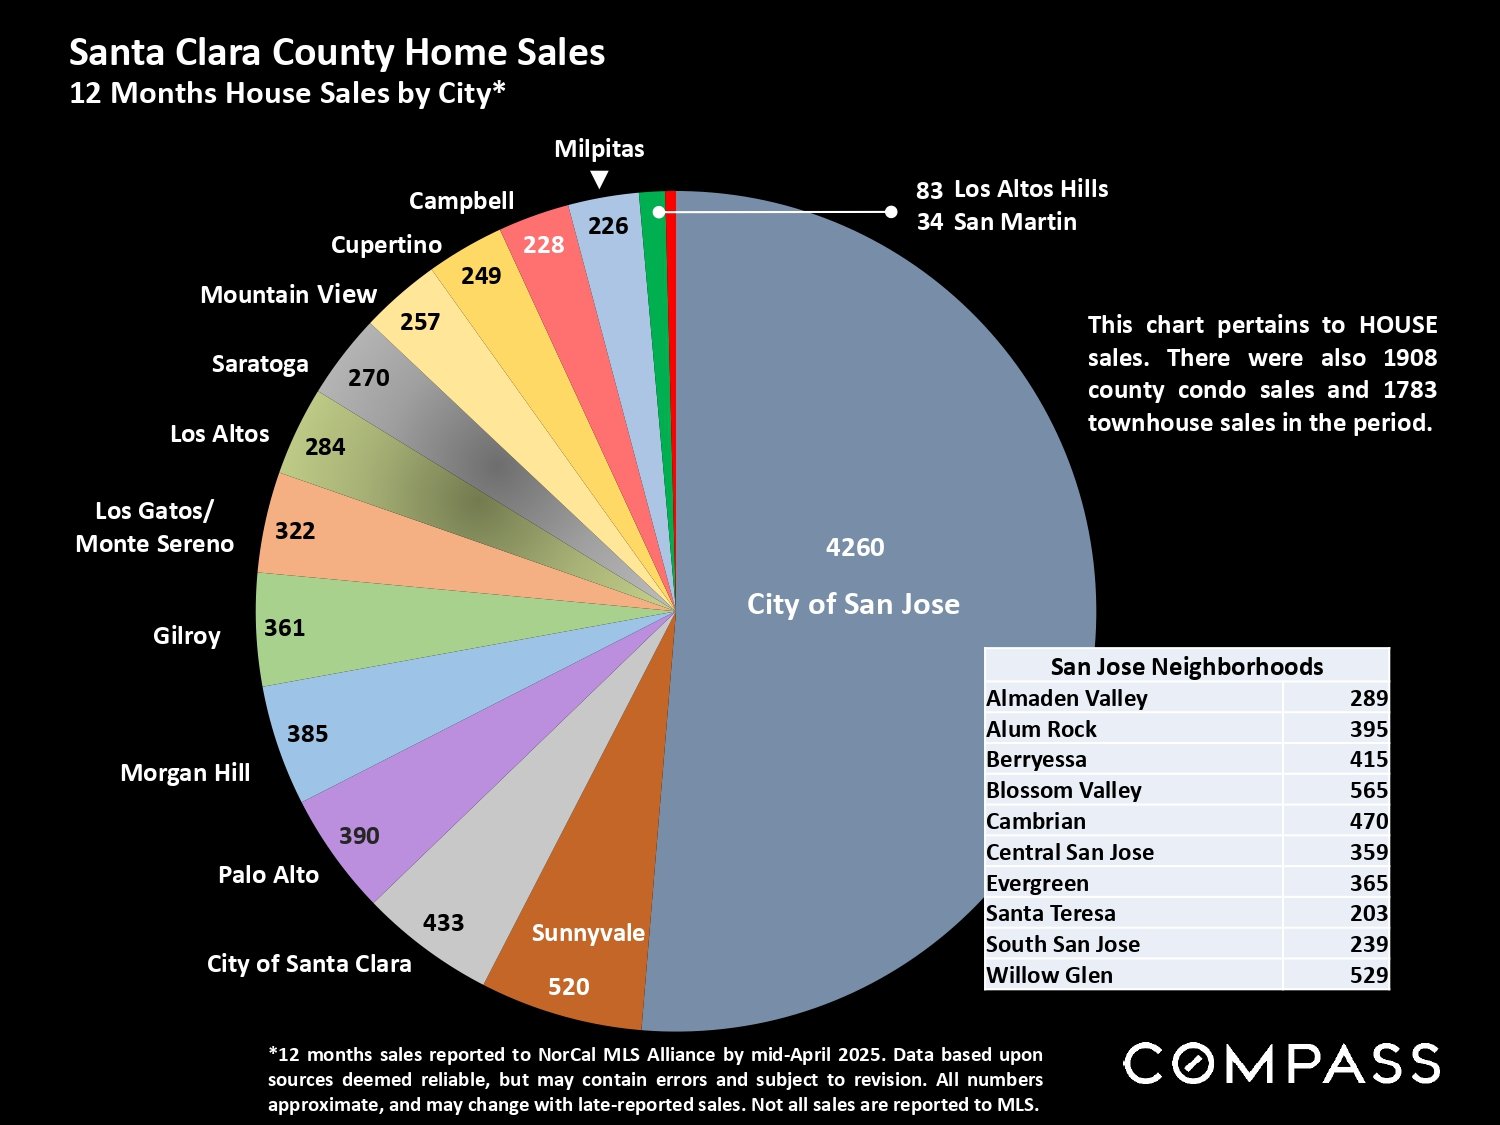
Chart of 12-month Santa Clara County home sales by city, with a pie chart and a table of San Jose neighborhood sales.
 
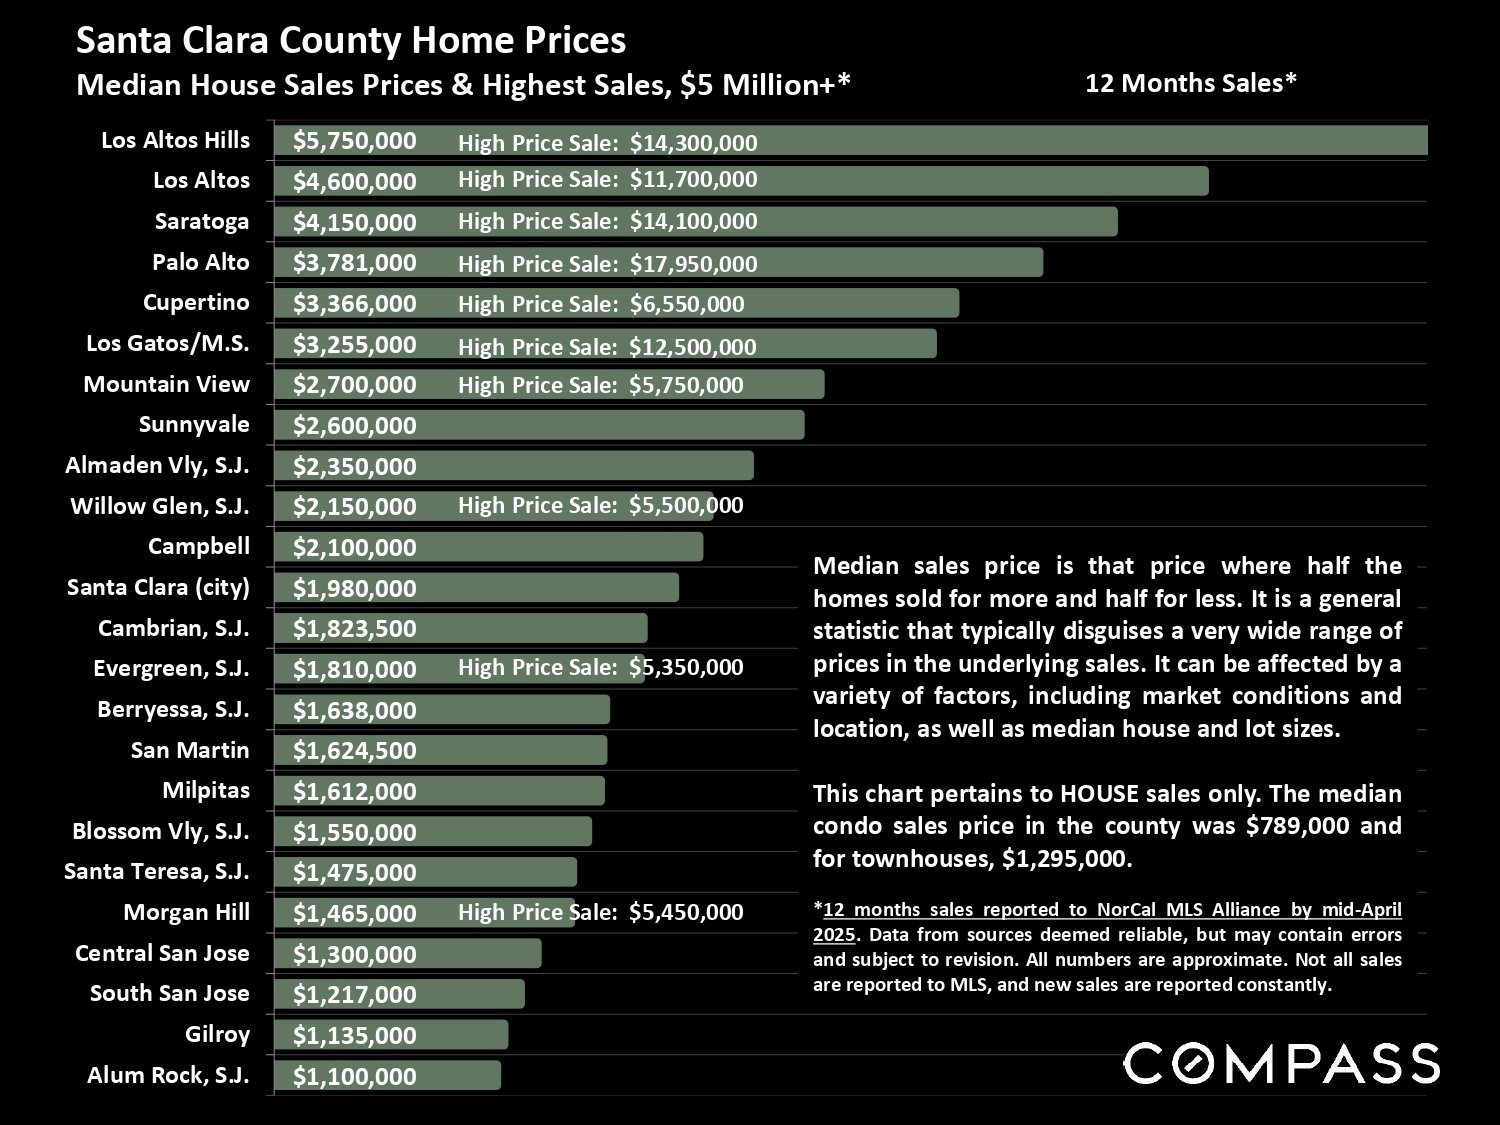
Chart of Santa Clara County median house prices by city, from $1.1 million in Alum Rock to $5.75 million in Los Altos Hills.
 
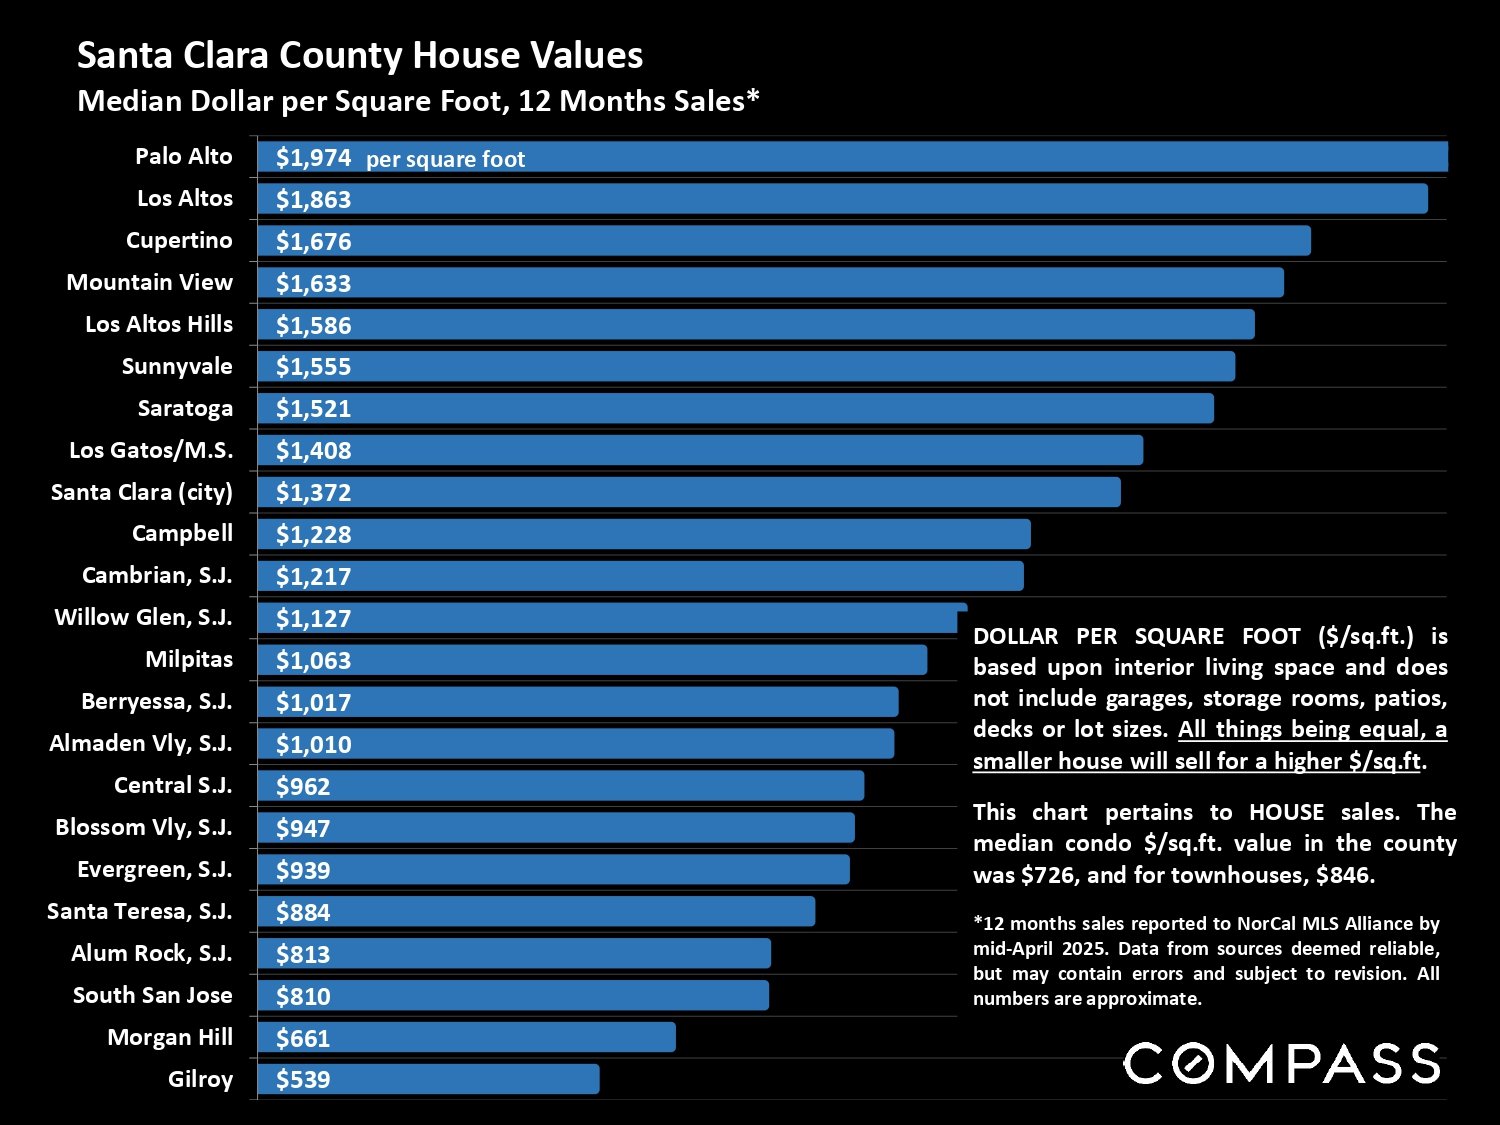
Chart of Santa Clara County house values per square foot, led by Palo Alto at $1,974 and ending with Gilroy at $539.
 
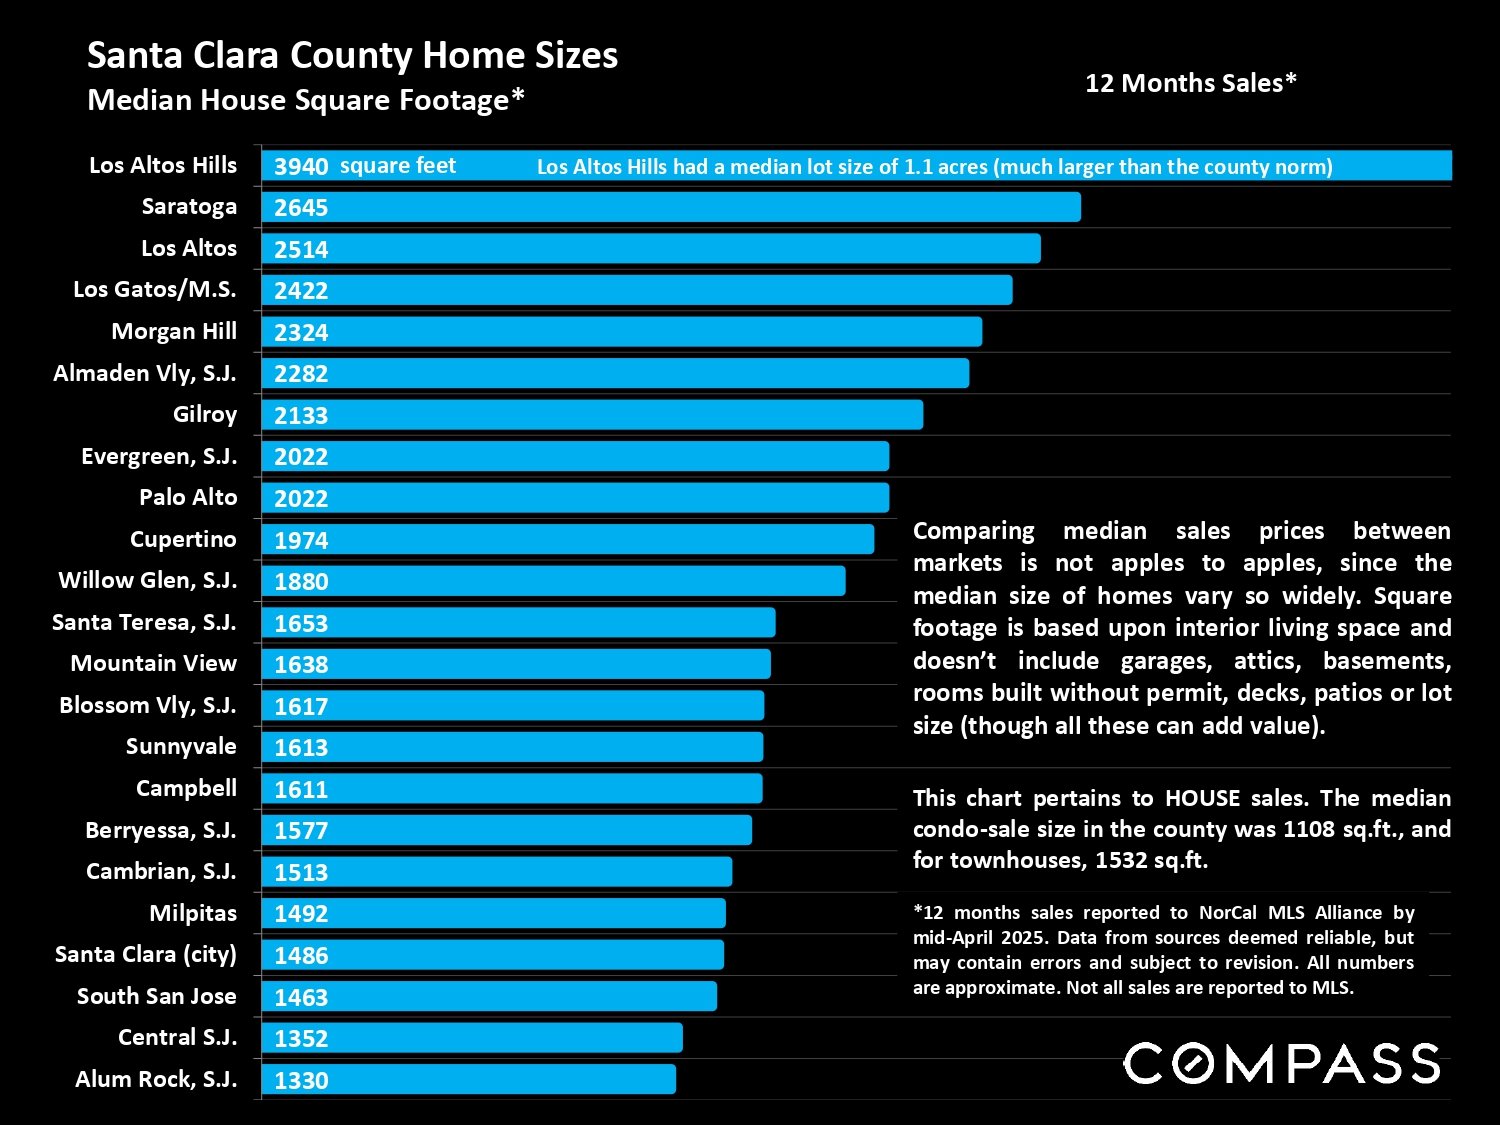
Chart comparing median house square footage across Santa Clara County cities, led by Los Altos Hills at 3,940 square feet.
 
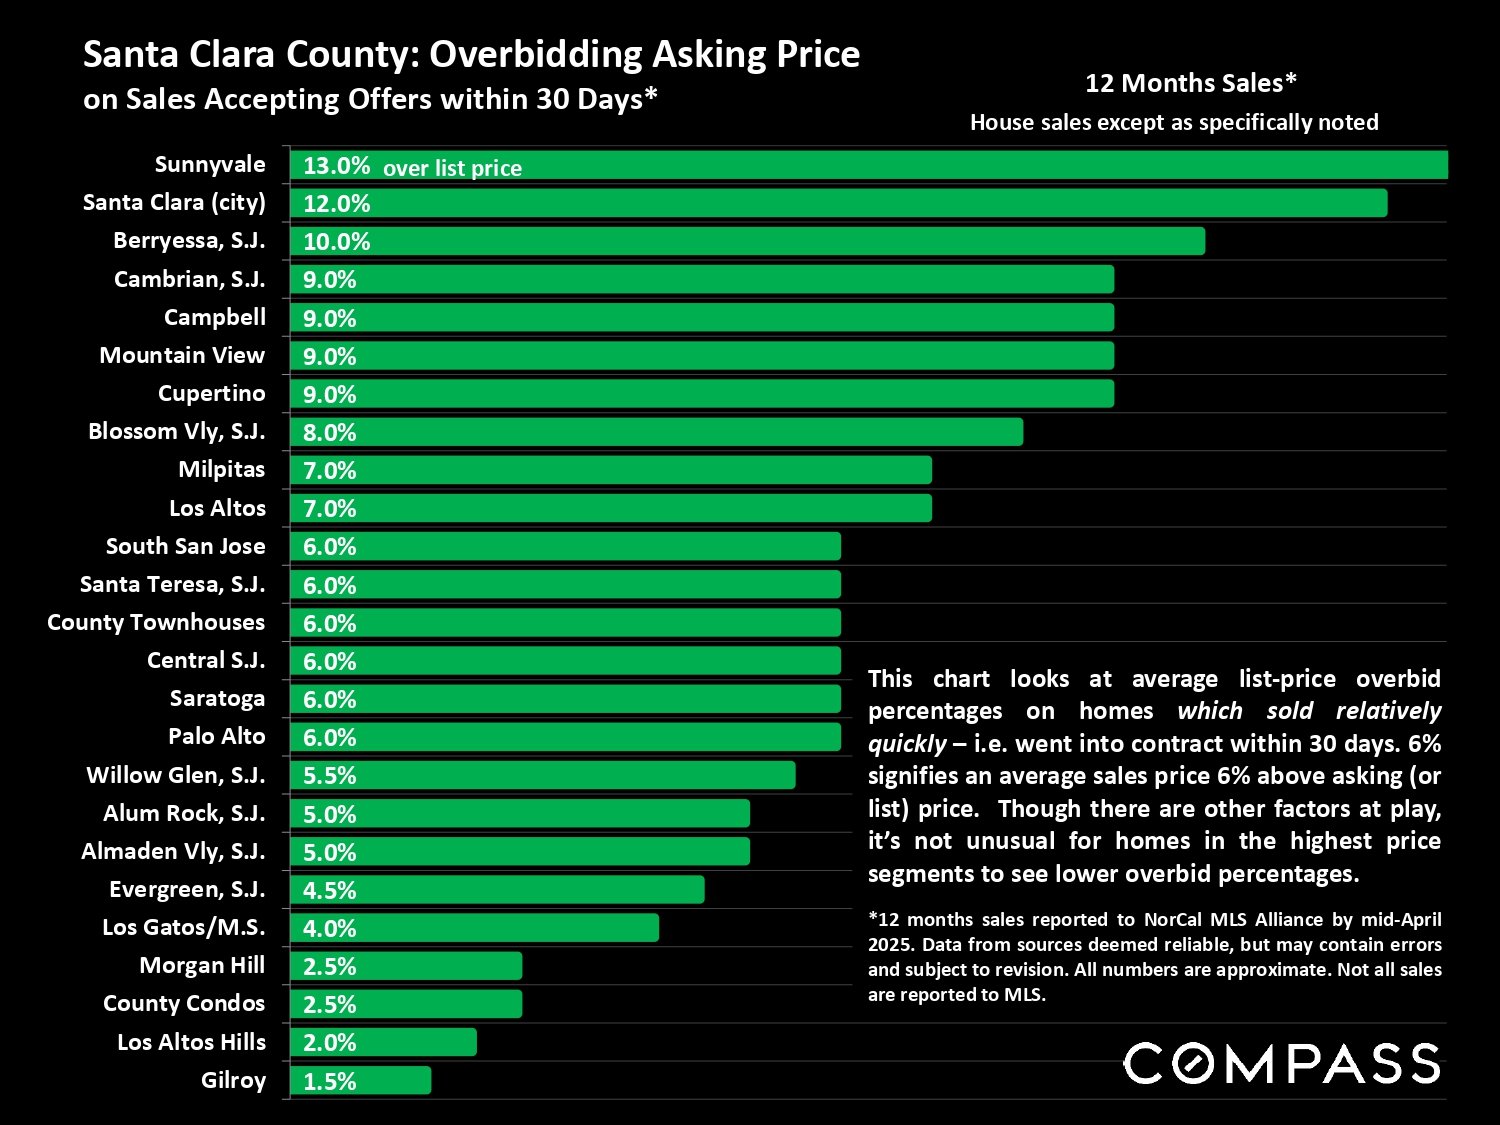
Santa Clara County overbidding chart ranks cities from Sunnyvale at 13% to Gilroy at 1.5%.
 
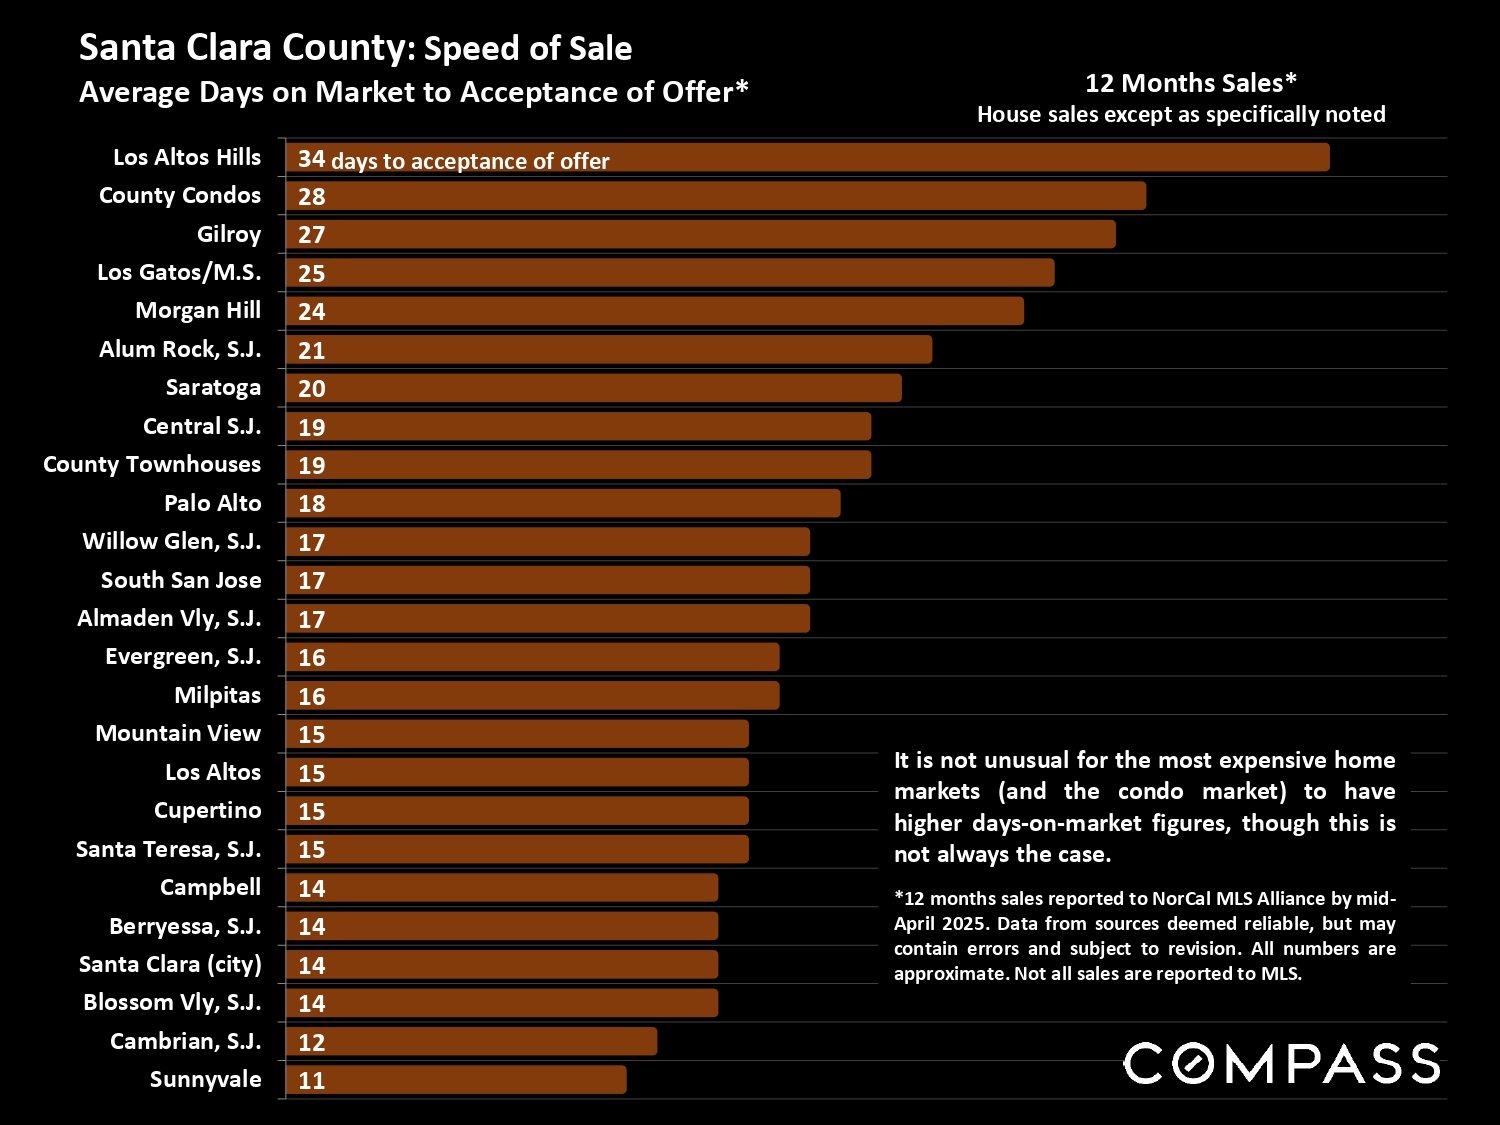
Santa Clara County home-sale speed chart, ranging from 34 days in Los Altos Hills to 11 in Sunnyvale.
 
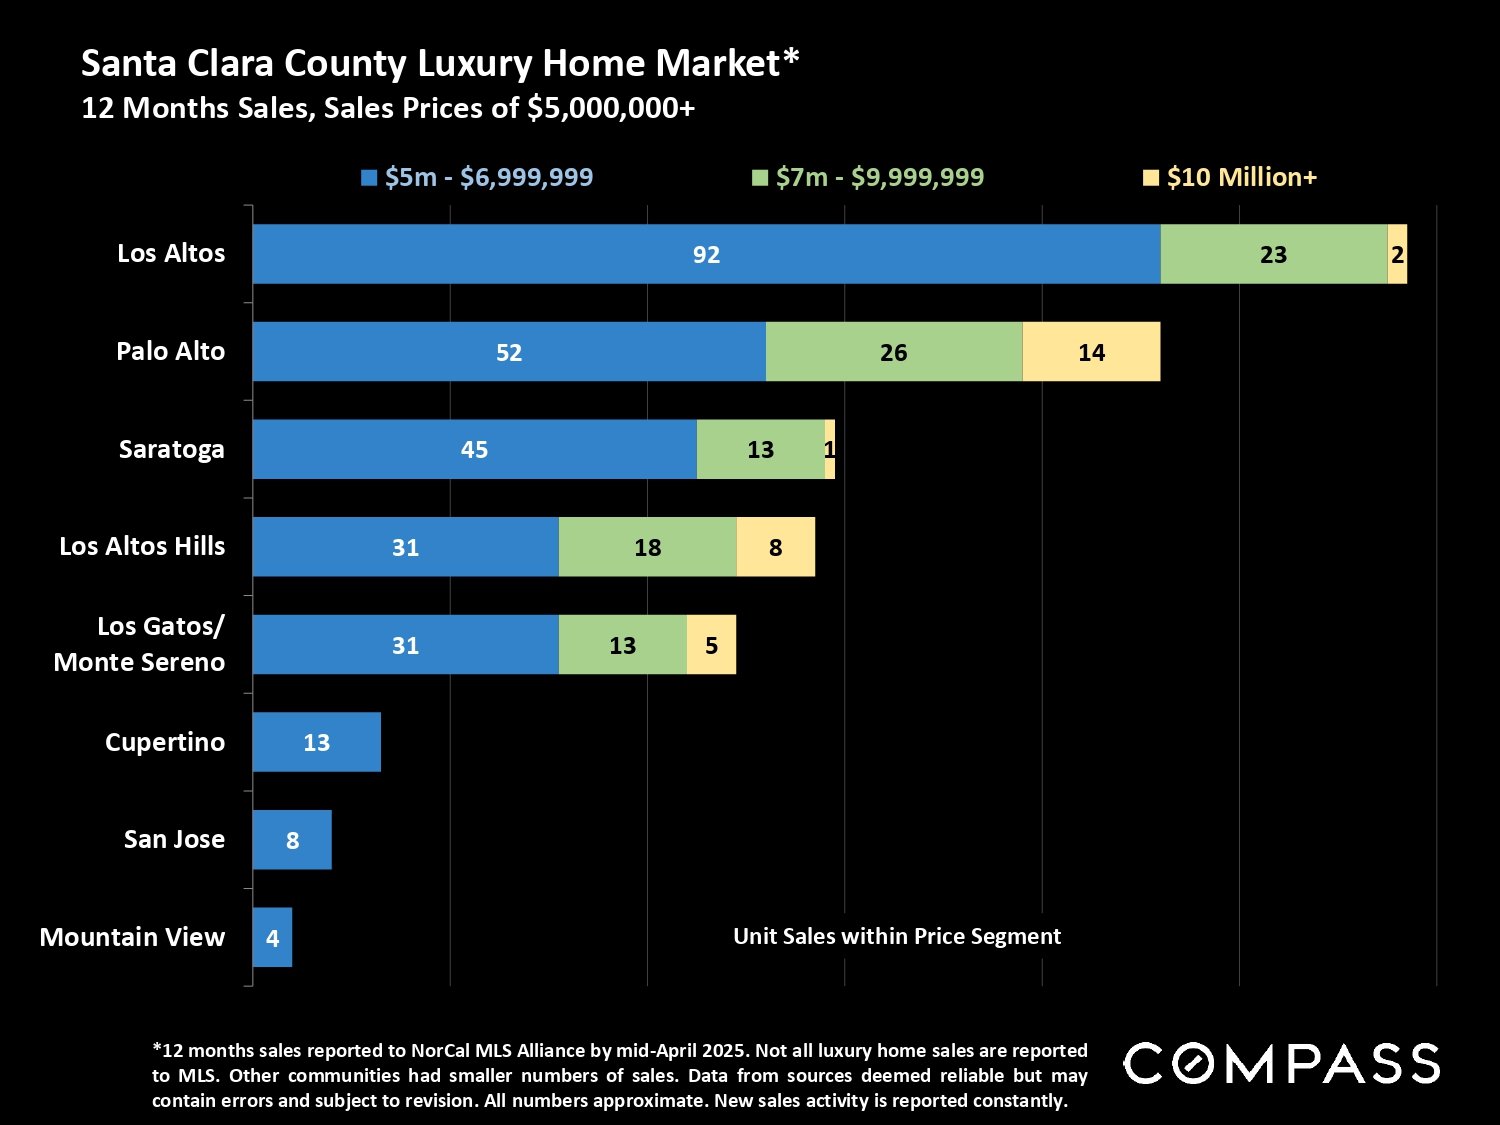
Santa Clara County luxury home sales by city and price segment, with Los Altos leading in $5–6.999 million sales.
 
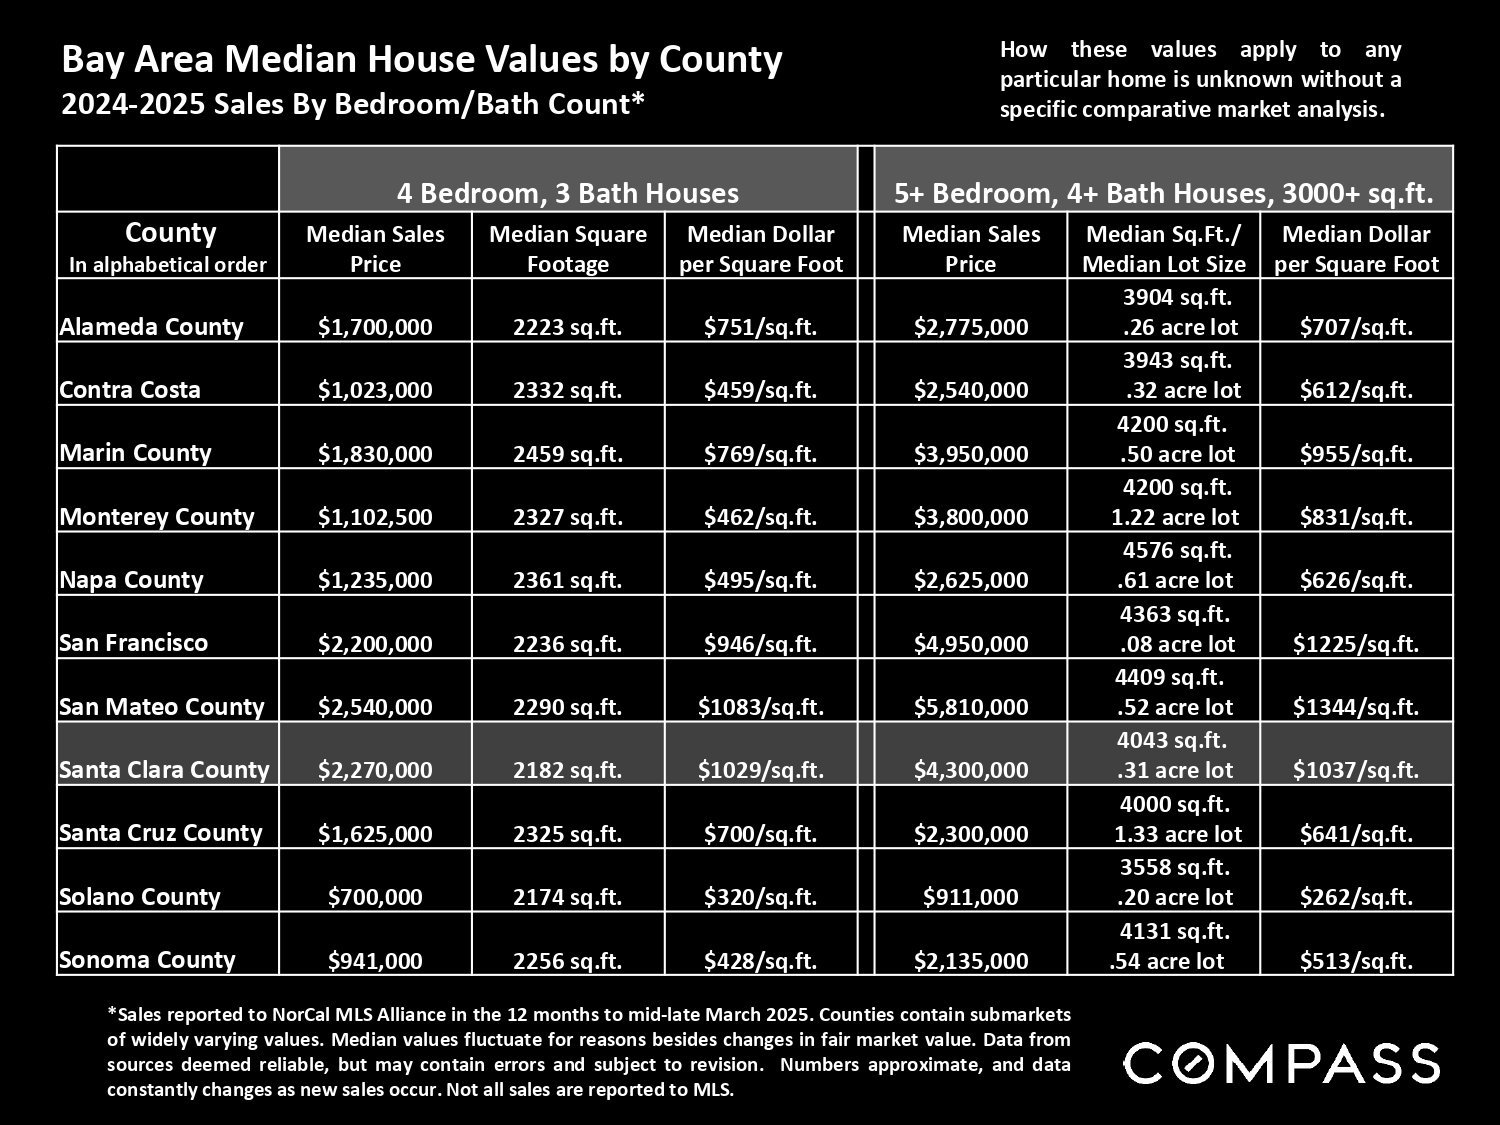
Bay Area county home-value table for 2024–2025, with Santa Clara County highlighted.
 
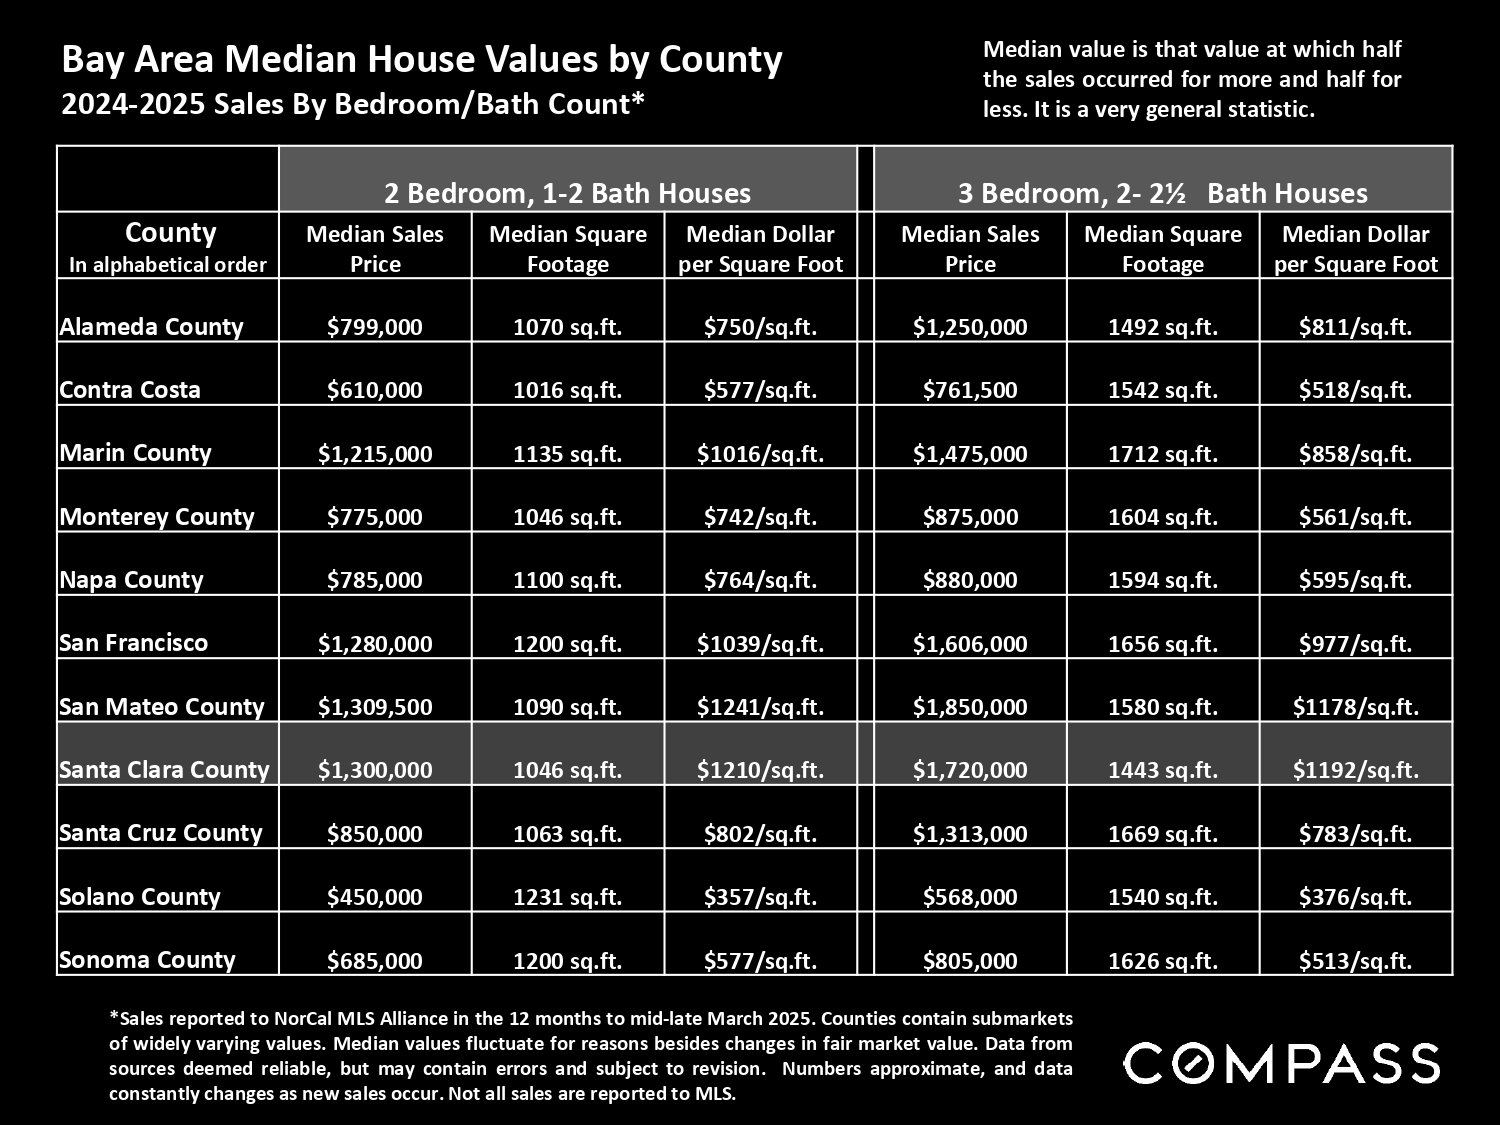
Bay Area county housing-value chart highlighting Santa Clara County’s median prices for two- and three-bedroom houses.
 
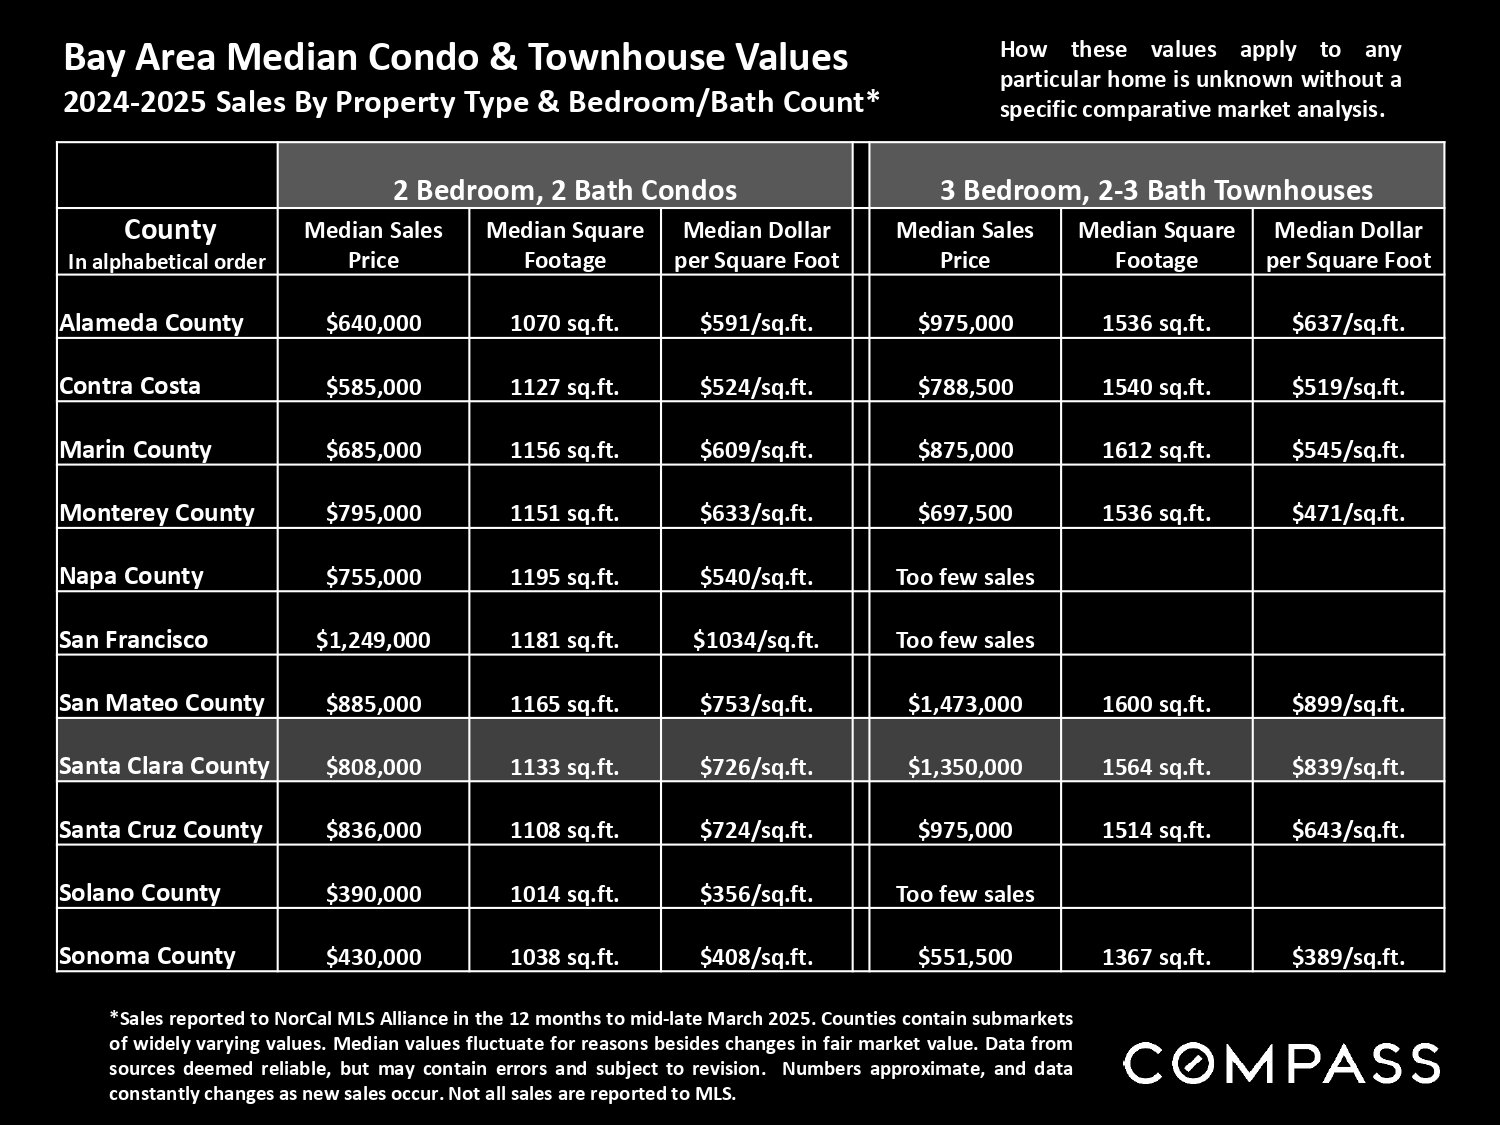
Bay Area condo and townhouse values table, with the Santa Clara County row highlighted.
 
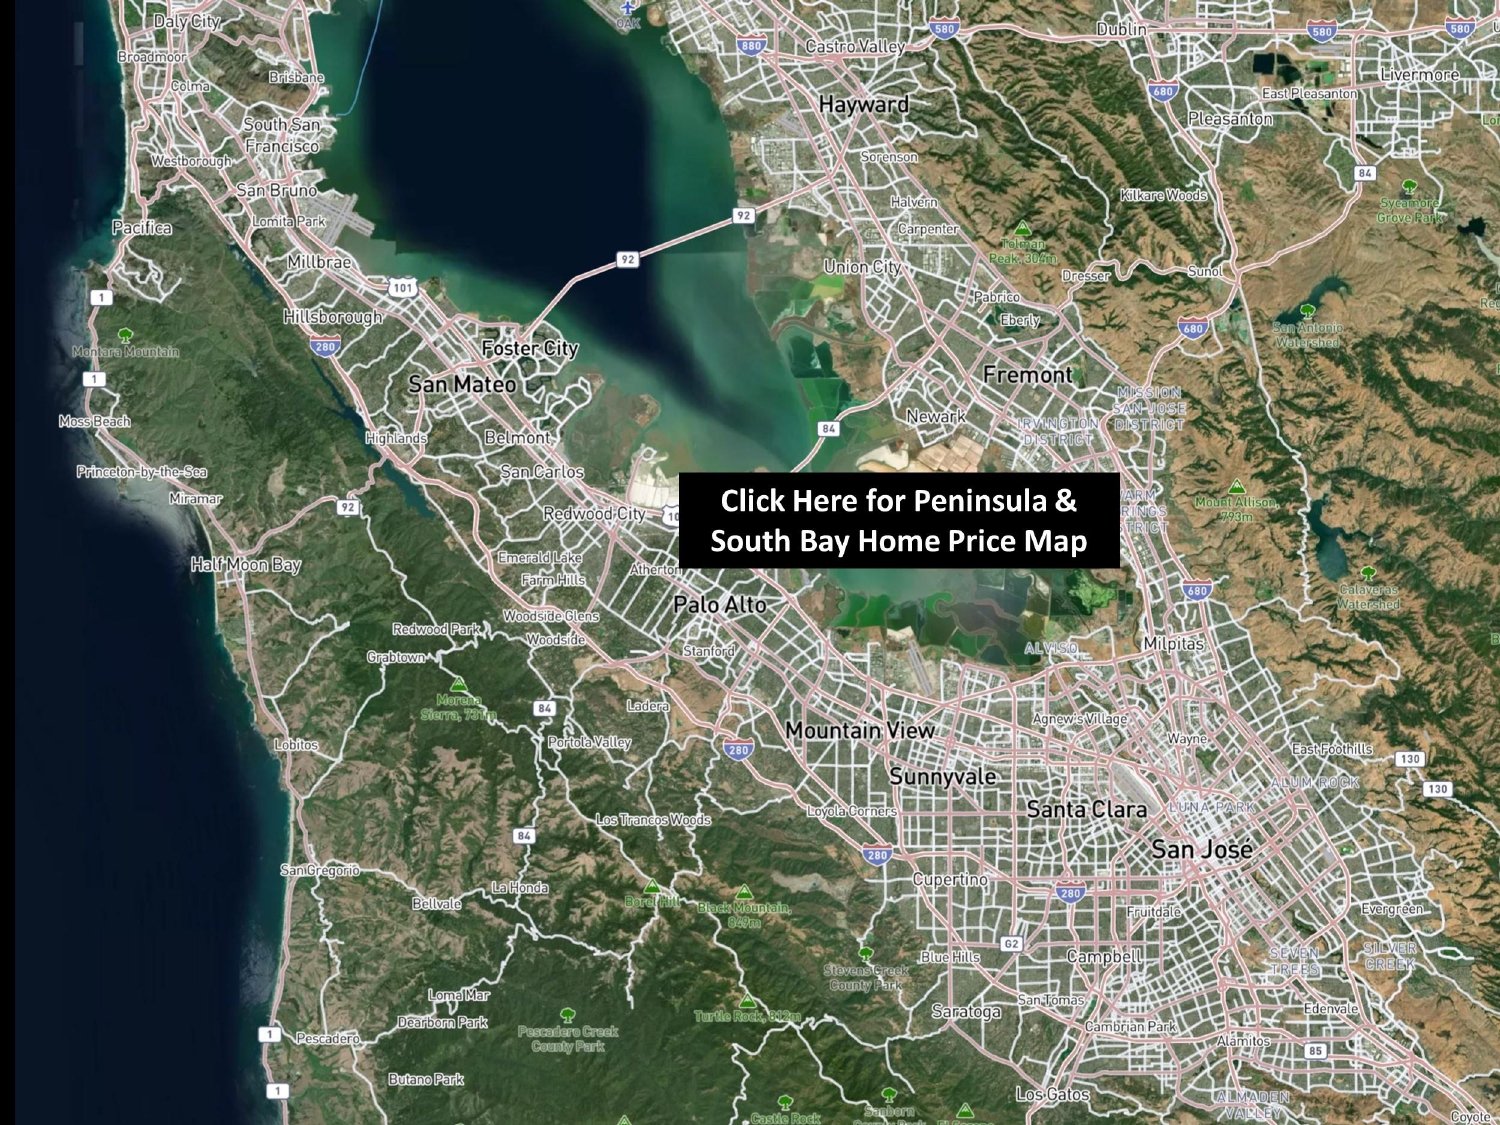
Map of Santa Clara County and surrounding Bay Area cities, with a link to the Peninsula and South Bay home price map.
 
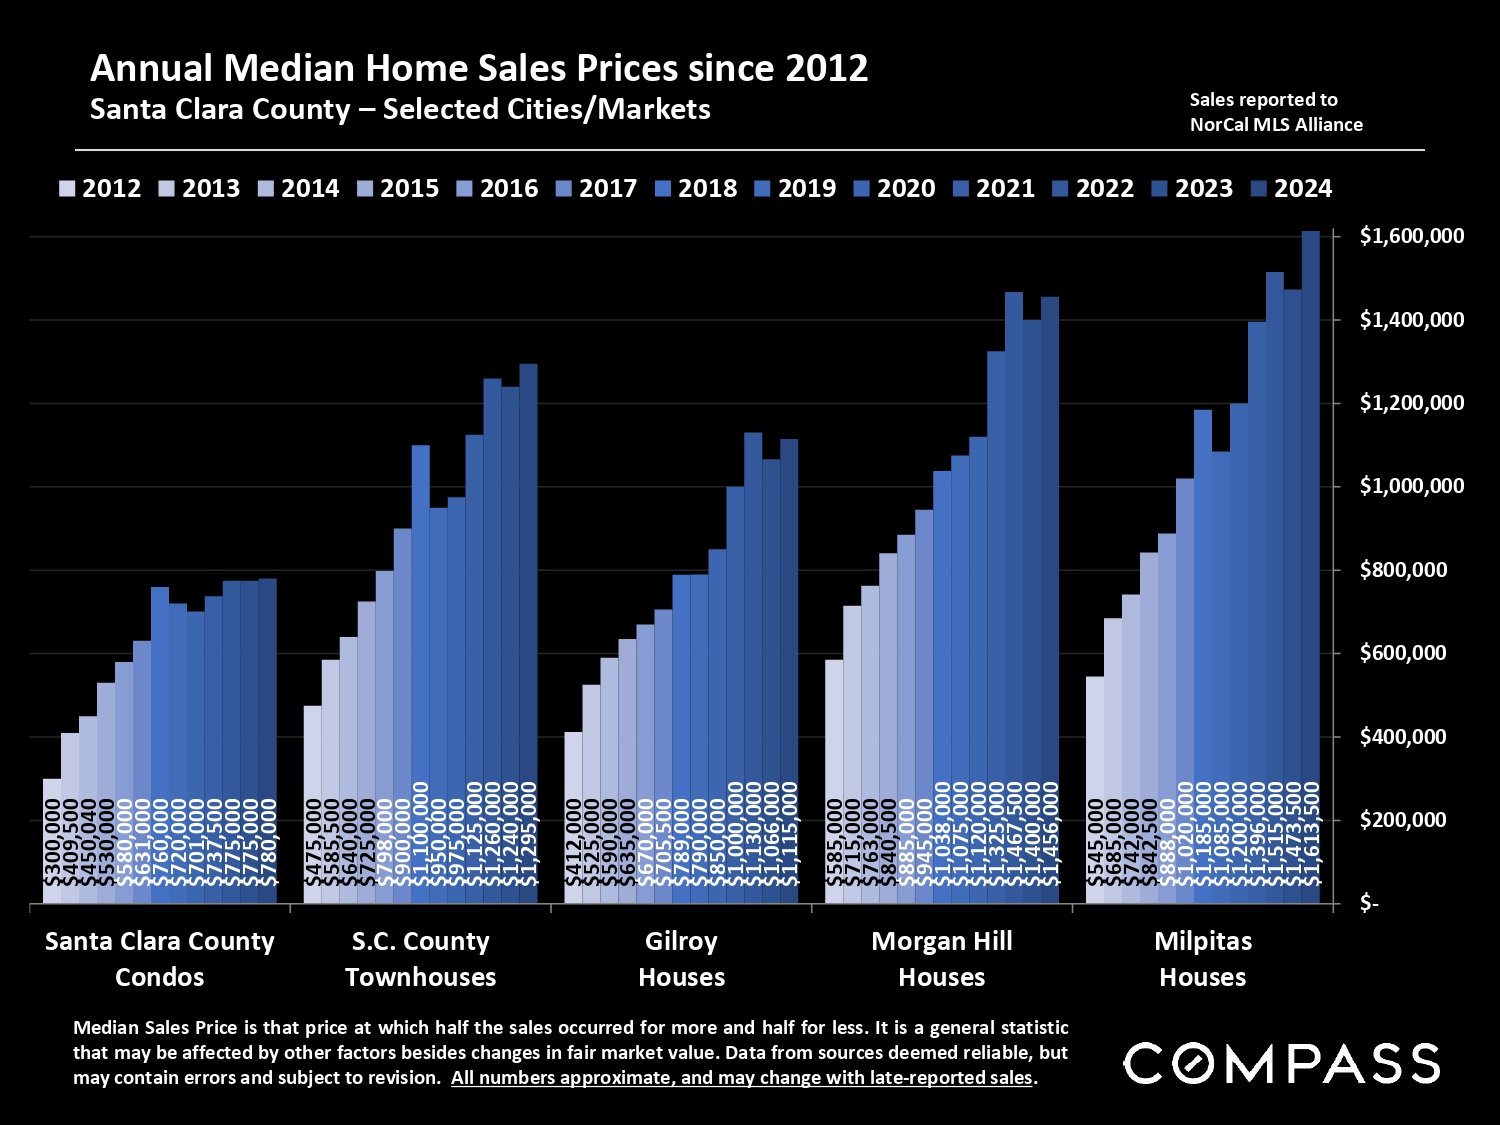
Bar chart of median home prices from 2012–2024 for Santa Clara County condos and townhouses, and homes in Gilroy, Morgan Hill, and Milpitas.
 
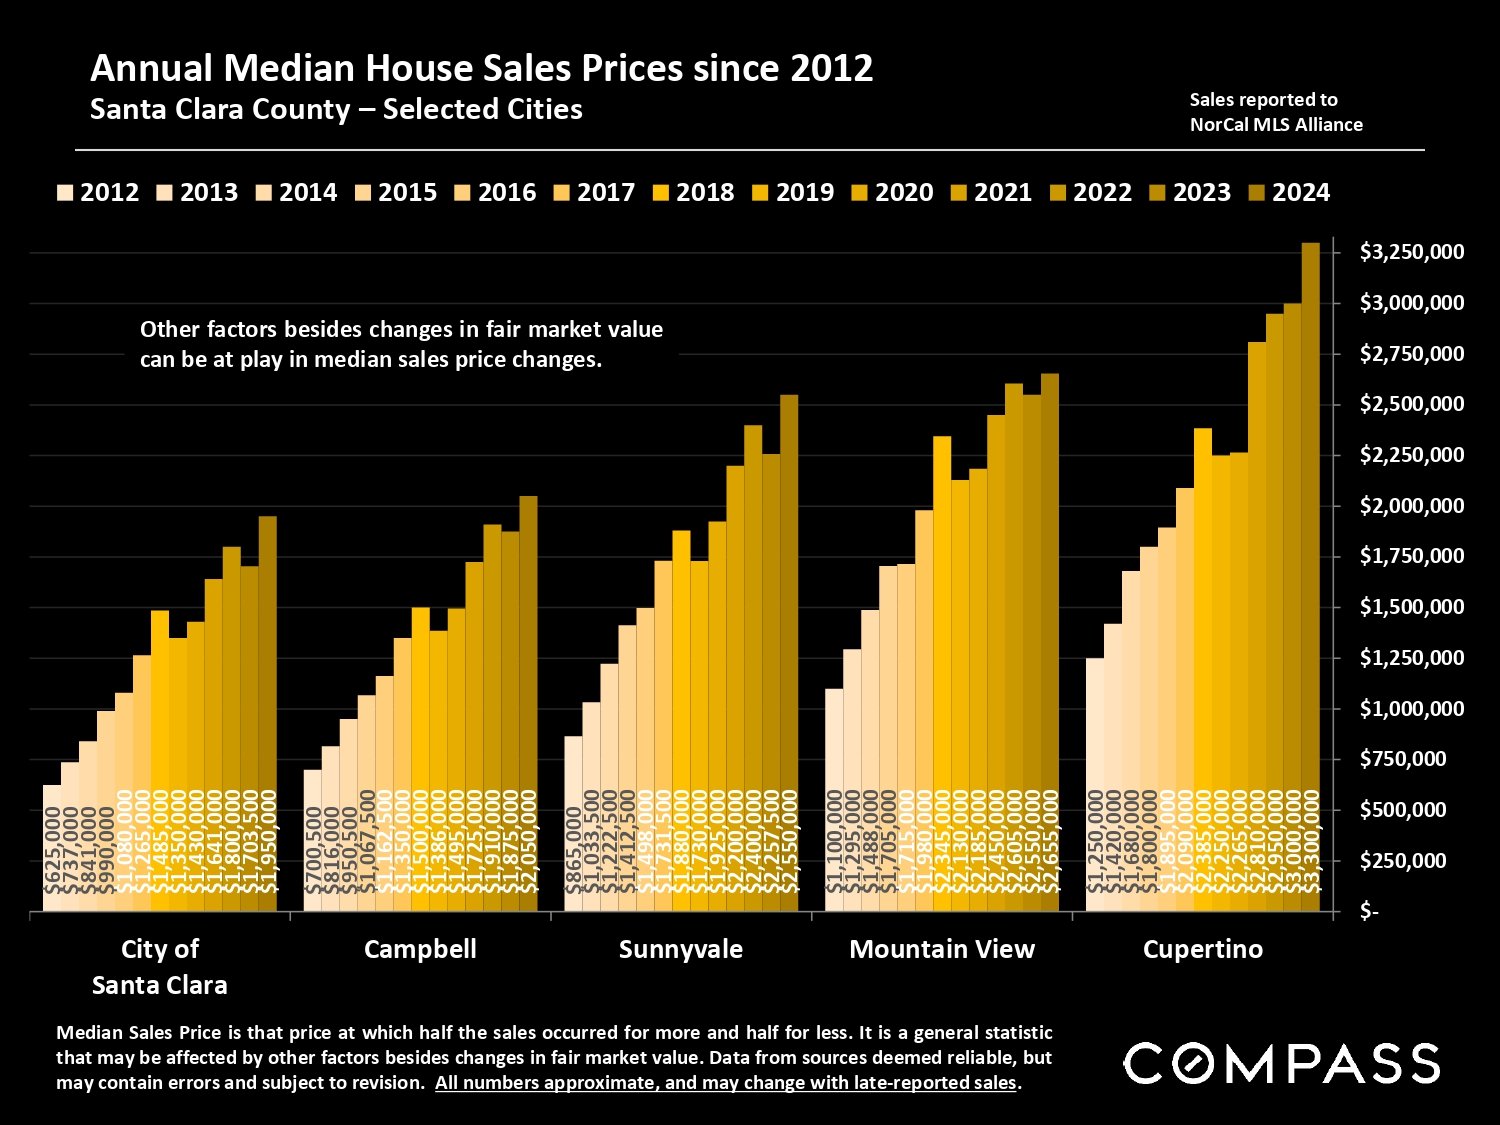
Bar chart comparing annual median home sale prices in five Santa Clara County cities from 2012 to 2024.
 
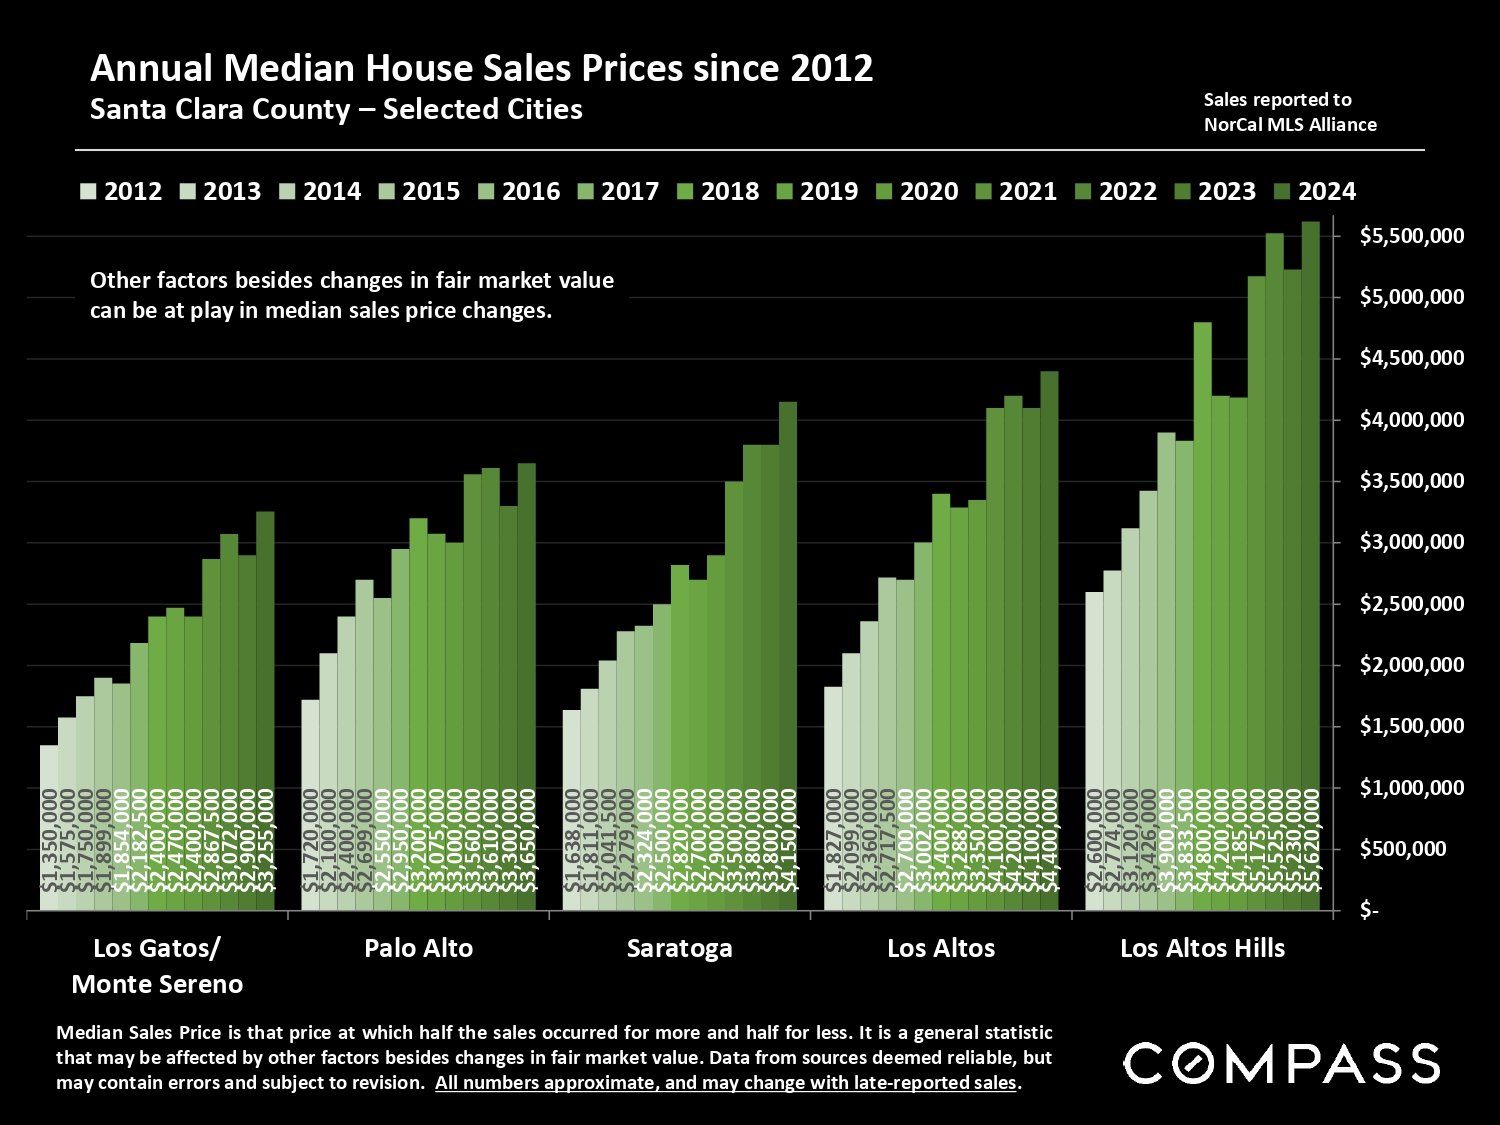
Chart comparing annual median house sale prices from 2012–2024 across five Santa Clara County cities.
 
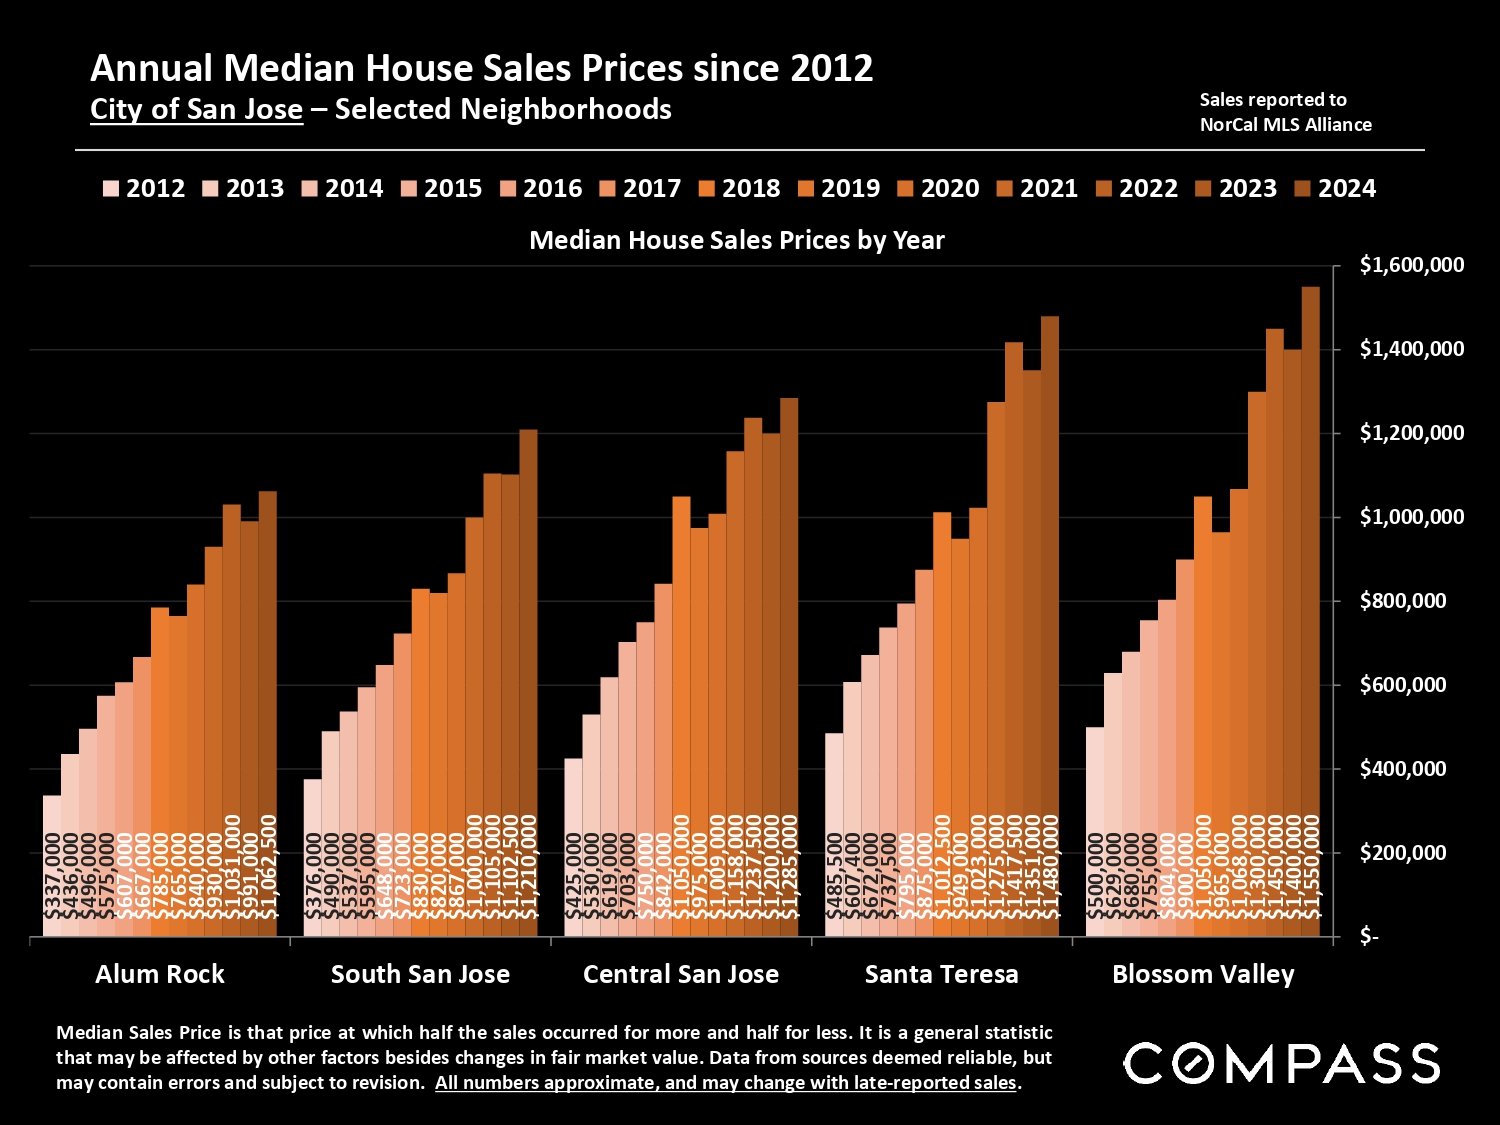
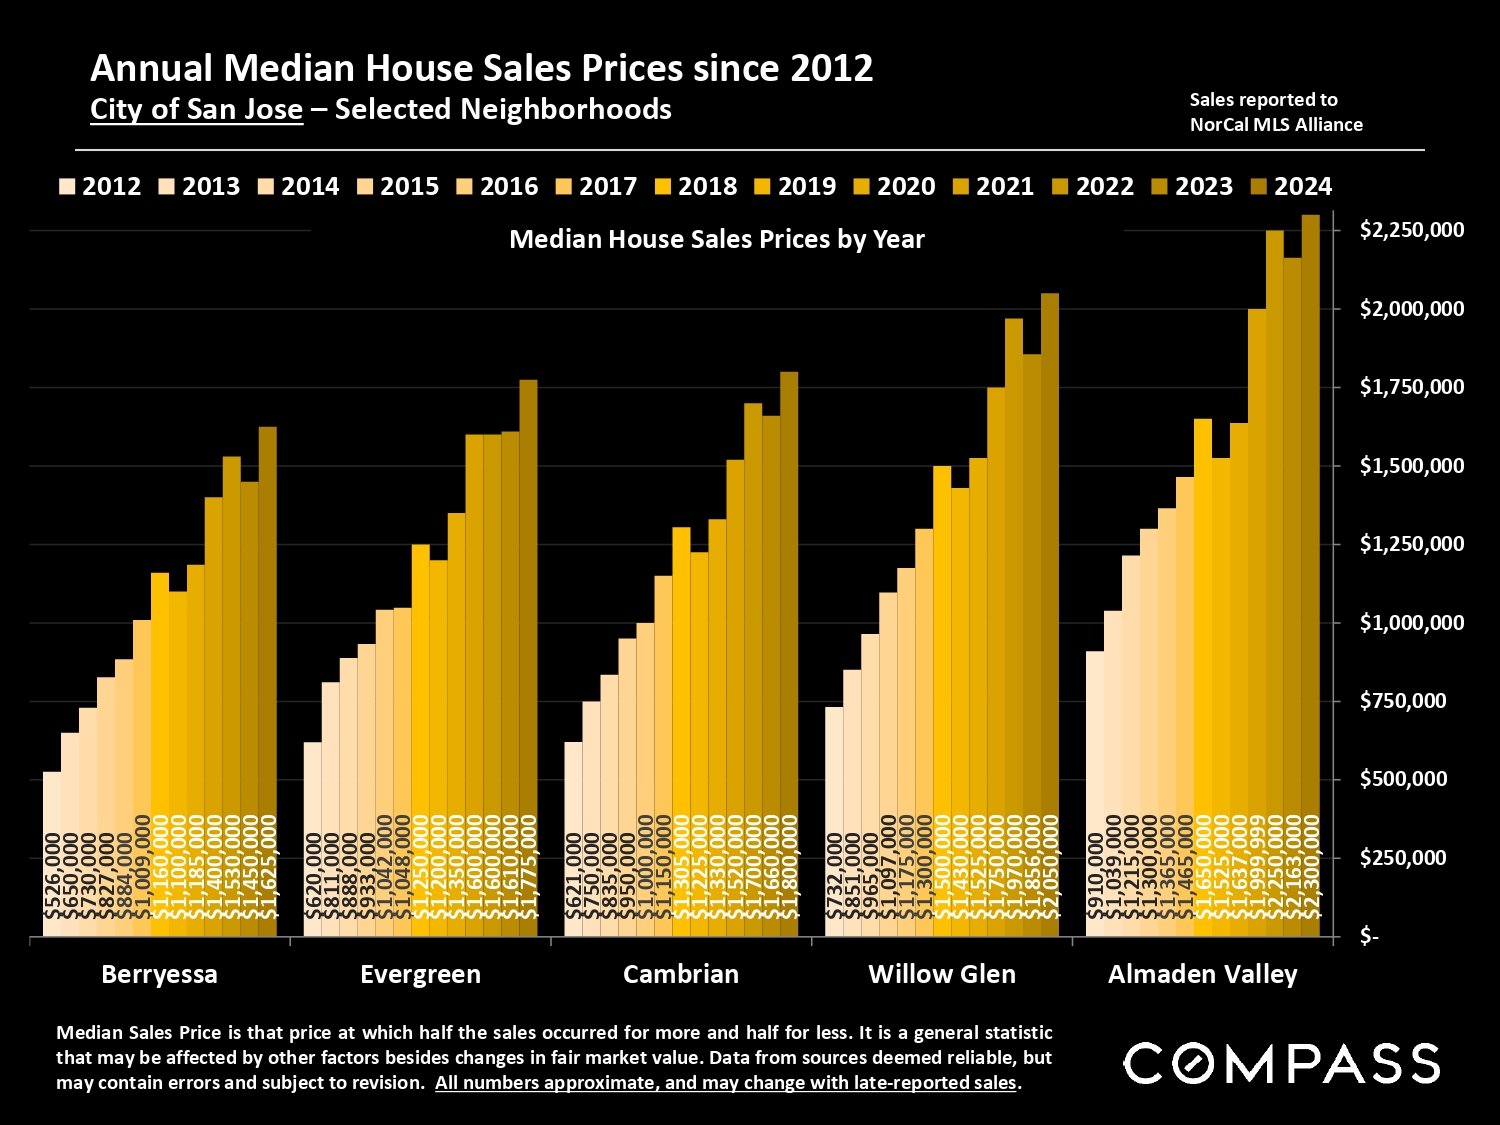
Chart of annual median house sale prices from 2012 to 2024 across five San Jose neighborhoods.
 
Chart of annual median house sale prices from 2012–2024 in five San Jose neighborhoods; Almaden Valley reaches about $2.3 million.
 
Explanatory notes on real estate statistics and a Compass disclaimer.